| головна | заповідник | імена | історія | документи | полеміка | посилання | про нас |
громадський комітет для вшанування пам'яті жертв бабиного яру |
комітет «бабин яр» |
|
|
ЗАПОВІДНИК
Проектно-пошукова робота по встановленню історичних меж Бабиного Яру та Кирилівського, Єврейського, Мусульманського, Караїмського кладовищ у м. Київ
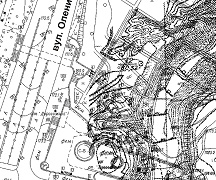
проект (project)Пояснювальна записка Explanatory notes Пояснювальна запискаМетою нашої роботи було відтворення історичного розташування урочища Бабин Яр, а також меж територій Єврейського, Кирилівського православного, Магометанського та Караїмського кладовищ у м. Києві та відображення цих об'єктів на сучасному топографічному плані міста. Зазначену роботу було проведено на основі архівних матеріалів: топографічних та інших планів міста, створених протягом ХХ ст., а також аерофотозйомки часів Другої світової війни. Цю дослідницьку роботу було поділено нами на чотири етапи: 1. Зведення всіх архівних і сучасних матеріалів до одного масштабу. 2. Накладання матеріалів за різні роки одне на одного для визначення меж кладовищ та межі Бабиного Яру. 3. Опрацювання отриманих матеріалів. 4. Виготовлення кінцевих графічних матеріалів. Архівні матеріали, що були використані нами в процесі досліджень: фрагмент генерального плану м. Києва 2008 року масштабу 1:2000, план відведення території під Єврейське кладовище 1892 року, план м. Києва 1914 року, топографічний план урочища Бабин Яр та прилеглих територій 1924 року, німецька аерофотозйомка 1943 року, план земельної ділянки Єврейського кладовища 1951 року, топографічний план урочища Бабин Яр та прилеглих територій 1953 року, топографічний план урочища Бабин Яр та прилеглих територій 1957 року, топографічний план урочища Бабин Яр та прилеглих територій 1969 року Далі подаємо опис кожного з етапів нашої роботи. Перший етап – зведення всіх архівних і сучасних матеріалів до одного масштабу. На цьому етапі ми за допомогою професійної ГІС (геоінформаційної системи) МapInfo 8.5 мали звести всі графічні матеріали до одного масштабу для подальшого їх опрацювання. Для цього нам треба було привести матеріали до однакової системи координат, яка в нашому випадку була обрана умовна для більш зручної прив'язки архівних матеріалів. Отже, це було реалізовано таким шляхом. Спершу ми відкрили у вищезазначеній ГІС фрагмент генерального плану Києва, якому програма за умовчанням в проекції "План-схема" надала власні координати прив'язки, похибка яких дорівнює нулю. По тому ми відкрили топографічний план урочища Бабин Яр 1953 року, обрали ту ж саму проекцію, лише обрали пункт "Реєструвати вручну". Відкрили дубль цієї ГІС-програми з попередньо прив'язаним планом Києва і шляхом знаходження опознаків об'єктів, що не змінилися, прив'язали план 1953 року за знятими з плану 2008 року координатами. Приклад такого опознака продемонстровано на рис. 1. 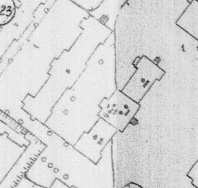 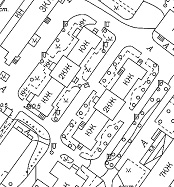 а)б)
Рисунок 1. Представлення об'єктів, що не змінилися а) з топографічного план 1953 року; б) з фрагменту плану 2008 року.
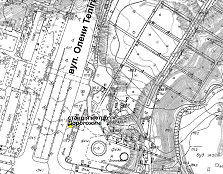
Ту ж саму операцію ми здійснили і з рештою графічних матеріалів. Слід відзначити лише прив'язку німецького аерознімку. Оскільки матеріал архівний, з часів війни, ми не мали кутів повороту літака, щоб зробити з ним ортофототрансформування, тим самим знівелювавши деформацію місцевості. Але оскільки зальот літака був високий і від нас не вимагалося надвеликої точності, то ми вирішили опустити цей момент, що підтвердилося позитивним результатом під час подальшого опрацювання матеріалу. Окрім цього моменту знімок був доброї якості (зважаючи на рік його виготовлення) і доволі легко підлягав дешифруванню. Його фрагмент представлено на рис. 2. 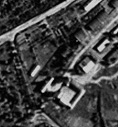 Рисунок 2. Фрагмент аерознімку 1943 року.
Другий етап – накладання матеріалів за різні роки одне на одного для визначення меж кладовищ та межі Бабиного Яру. На цьому етапі ми використовували матеріали, вже зведені до одного масштабу на попередньому етапі. За допомогою програмного пакета Corel Draw 12 ми мали отримати три накладені матеріали для подальшого їх опрацювання, як підоснови для кінцевих графічних матеріалів, а саме: фрагмент топографічного плану урочища Бабин Яр 1924 року накладений на фрагмент генерального плану Києва 2008 року масштабу 1:2000; фрагмент топографічного плану урочища Бабин Яр 1953 року накладений на фрагмент генерального плану Києва 2008 року масштабу 1:2000; фрагмент генерального плану Києва 2008 року масштабу 1:2000 накладений на німецьку аерофотозйомку 1943 року. Для реалізації цього завдання ми попарно відкривали вище перераховані графічні документи в пакеті Corel Draw 12 і за допомогою функції, що робить фон другого документа прозорим (приклад функції представлено на рис. 3) накладали відповідні матеріали одне на одного, керуючись все тими ж опознаками, спільними осями доріг та ізолініями Бабиного Яру, що залишились незмінними. Оскільки всі документи раніше були приведені до одного масштабу, це значно полегшило наше завдання. Приклад результатів накладки представлено на рис. 4. 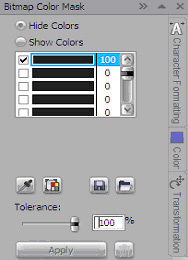 Рисунок 3. Приклад функції маніпулювання кольорами зображення
  а)б)
 в)
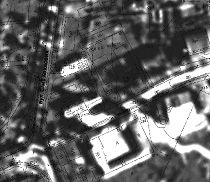
Рисунок 4. Представлення фрагментів накладених зображень документів одне на одного: а) накладене зображення Бабиного Яру 1953 року на план 2008 року; б) накладене зображення Бабиного Яру 1924 року на план 2008 року; в) накладене зображення плану 2008 року на німецьку аерофотозйомку 1943 року.
Отже, на цьому етапі ми підготували підоснову для подальшого опрацювання і перейшли до наступного, третього, етапу обробки. Третій етап – опрацювання отриманих матеріалів. На цьому етапі ми знову повернулися до професійної ГІС МapInfo 8.5. Завдання цього етапу було – окреслити межі кладовищ за всі роки і нанести їх на створену раніше підоснову. Це було реалізовано у такий спосіб. Ми почергово відкривали в ГІС МapInfo 8.5 раніше, на першому етапі, прив'язані файли вихідних документів, знімали з них межі кладовищ і зберігали кожну з них за хронологічним порядком в окремому шарі і файлі (таблиці), надаючи їй окремі візуальні характеристики, а у випадку аерознімка проводили дешифрування меж. Потім, оскільки всі документи було зведено до одного масштабу, накладали файли меж на раніше створену підоснову, в результаті чого отримували цілісну картину динаміки зміни меж кладовищ за відповідні роки. За допомогою діалогу «Менеджер шарів» ми мали змогу маніпулювати відображенням межі кладовища за той чи інший рік (рис. 5). 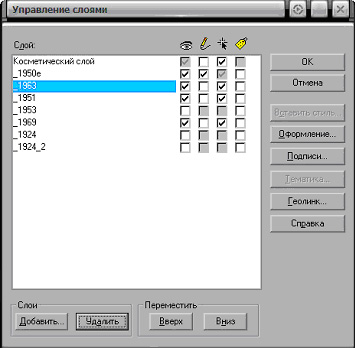 Рисунок 5. Менеджер управління шарами ГІС МapInfo 8.5.
Результат нанесення всіх меж на підоснову продемонстровано на рис. 6. 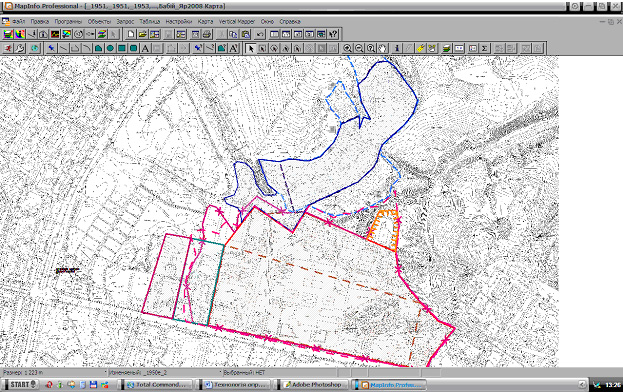 Рисунок 6. Межі кладовищ за всі роки, накладені на підоснову 2008 року.
Але, оскільки, як видно з рисунка, якщо накласти всі межі кладовищ одночасно, документ не є читабельним, ми вирішили розділити накладання на три часових періоди: межі кладовищ, що існували до 1924 року; межі кладовищ, що існували в період з 1924 року по 1969 рік; і межі кладовищ, що існували з 1951 року по 1969 рік. До перераховних матеріалів ми вирішили додати ще два варіанти, на одному з яких на підоснову аерозйомки 1943 року і плану міста 2008 року накладено межі кладовищ за період з 1924 року по 1969 рік для більшої їхньої наочності. А на другому матеріалі ми вказали на підоснові 2008 року максимальні межі кладовищ за всі роки. Четвертий етап – виготовлення кінцевих графічних матеріалів. На кінцевому етапі нашої дослідницької роботи ми мали оформити вже зазначені раніше кінцеві матеріали для подальшого їх друку. Для цього в ГІС МapInfo 8.5 ми скористались функцією «Звіт», обрали формат листа А1, оскільки територія місцевості є великою, а ми вирішили вивести всю документацію в масштабі 1:2000. На цьому листі ми позначили межі кладовищ, розбиті на вищевказані періоди, додали до кожного з них назву документації та умовні позначення, що її характеризують. У результаті нашої дослідницької роботи ми розробили вказаним вище методом п'ять графічних документів, що характеризують зміну меж кладовищ залежно від часу, висвітлюють територію місцевості, яку вони займали, вказану на сучасному плані, та зону масового розстрілу мирного населення та військовополонених під час нацистської окупації м. Києва. Зону масових розстрілів визначено на підставі комплексного дослідження наративного, фотографічного і картографічного матеріалу, а також тривимірної реконструкції території Бабиного Яру. Також на них вказано повну територію, на якій розташовувався Бабин Яр. Вся графічна документація супроводжується цим текстом. Інженер-фотограмметрист Четверіков Б.В. Technology of the historical documents study of Babyn Yar and the Boundaries of the adjacent Cemeteries RestorationThe aim of our work was to retrieve historical position of Babyn Yar on the modern plan of Kiev and to show the boundaries of location of the Jewish, Kyril Christian Orthodox, Mohammedan, and Karaite cemeteries using archival materials (aerial survey and pre-war (post-war) topographical plans of the city). We divided this researching work on four stages: 1. Adjustment of the all archival and modern materials to the same scale; 2. Applying the all cartography materials of different years to define the boundaries of the cemeteries and boundaries of Babyn Yar; 3. Processing prepared materials; 4. Production of the final graphical materials. We used the following archival materials in the study process: fragment of general city plan of Kiev of 2008 by scale 1:2000, 1892 plan of the Jewish cemetery, 1914 City plan of Kiyiv, 1924 topographical plan of the Babyn Yar ravine and the adjacent parcels, German aerial photo of 1943, Jewish cemetery plan of 1951, 1953 topographical plan of the Babyn Yar ravine and the adjacent parcels, 1957 topographical plan of the Babyn Yar ravine and the adjacent parcels, 1969 topographical plan of the Babyn Yar ravine and the adjacent parcels. Detailed description of each stage of the work. First stage – adjustment of the all archival and modern materials to the same scale. On this stage we used professional GIS (geoinformation system) MapInfo 8.5 to adjust all cartography materials to the same scale for their further processing. To achieve this we had to bring all materials to the same co-ordinate system which in our case was chosen as conventional with purpose of more convenient referencing the archival materials. In general it was realized in the following way: First we opened fragment of general plan of Kiev using the above mentioned GIS, to which the program was reflecting to produce the schematic Plan with the own referenced co-ordinates, errors of which were equal zero. Then we had opened the topographic plan of the 1953 Babyn Yar terrain with the same co-ordinates as of 2008. At the same time we opened the double of the GIS program with previously referenced plan of Kiev and comparing the plans we found the unchanged objects. After that we bound the 1953 plan with the 2008 plan according to the obtained 2008 plan's coordinates. The example of this recognized object is shown on the figure 1. а)b)
Fig 1. image of the objects which did not change a) on topographical 1953 plan; b) on fragment of 2008 plan.
The same operation we made with the rest of graphical materials. It should be noted only referencing of the German aerial photo. As this material was taken from the archive we did not have angles of the air plane orientation to properly implement the photo into the orthophoto transformation program and Babyn Yar the same leveling surface deformation. But as flight's altitude was high and extra accuracy was not required therefore we decided to omit this moment and later the positive result of material processing had proved that decision. In addition the image was of good quality (considering the year of producing) and could be interpreted quite easy. Its fragment is shown on figure 2. Fig. 2. Fragment of aerial 1943 image.
Second stage – Overlaying materials of different years one to the another for determination of the boundaries of the cemeteries and boundaries of the Babyn Yar. At this stage we used materials from the First stage. Using program package Corel Draw 12 we supposed to get three overlaid materials for further their application as base maps for final graphical materials, namely: the fragment of topographical plan of terrain Babyn Yar of 1924 was superimposed on the fragment of general plan of Kiev of 2008 in a scale of 1:2000; the fragment of topographical plan of Babyn Yar terrain of 1953 was superimposed on the fragment of 2008 general plan of Kiev in a scale of 1:2000; the fragment of 2008 general plan of Kiev in a scale of 1:2000 was superimposed on the 1943 German aerial photo; To get this task reached we opened above mentioned graphical materials in pairs in the program package Corel Draw 12. Then applying the function which could make the background of one document as transparent (the example of the function is shown on figure 3) we overlaid corresponding materials one with the other considering the mentioned control points, common road axes and isoline of Babyn Yar which were unchanged. As all documents had already been corrected to the same scale it considerably simplified our task. The example of overlaying results is shown on figure 4. Fig. 3. Example of function manipulating with the image colors.
а)b)
c)
Fig. 4. On Images of the superimposed documents applied on the one to another:
a) superimposed image of the Babyn Yar of 1953 to the city-plan of 2008; b) superimposed image of Babyn Yar of 1924 to the plan of 2008; c) superimposed image of the plan of 2008 to German aerial photo of 1943. Thus on this stage we prepared under laying maps as background layers for our following processing and we were able to start next third stage of the work. Third stage – processing prepared materials. On this stage we again returned to professional GIS MapInfo 8.5. Our task on this stage was to outline the boundaries of the cemeteries for the period of all years and draw them on the early created background layers. It was done in the following way. In the GIS MapInfo 8.5. we opened Babyn Yar and put the files to the materials referenced earlier on the first stage. Then we applied the cemetery boundaries and saved each of them in chronological order in separate layers and files (tables) assigning to their separate visual characteristics. For aerial photos the interpretation of boundaries was additionally implemented. Then, as all documents were corrected to the same scales then we could overlay the files with boundaries on the early created background layers and in result of that we had got integral picture of dynamic changes of the cemety boundaries through the years. Using the dialog window "Layer manager" we had possibility to manipulate with the images of the cemetery boundaries from the one to another year (figure 5). Fig. 5. Layer Manager of GIS MapInfo 8.5.
Results of the all outlined boundaries is shown on figure 6. Fig.6. Boundaries of the cemeteries for the period of all years superimposed on the background map of 2008.
As we could see from the figure in the case of simultaneous overlaying of all cemetery boundaries the document was not readable. So we decided to divide the overlaying on three time period: cemetery boundaries existed till 1924; cemetery boundaries existed since 1924 till 1969 and cemetery boundaries existed since 1951 till 1969. Besides that to these materials we decided to add two more variants. On the one material the cemetery boundaries for the period from 1924 till 1969 were superimposed on the joint background layer of aerial survey of 1943 and city plan of 2008 for better their illustrations. On another material we showed on the background of 2008 the maximum boundaries of the cemeteries for all years. Fourth stage - production of the final graphical materials. On this final stage of our researching work we should design all above mentioned materials and prepare them for printing. For this we used the function "Report" in GIS MapInfo 8.5 and choose paper size A1. As the area of the terrain is large we decided to prepare all documentation in scale 1:2000. On the sheet we outlined the cemetery boundaries, divided on the above mentioned periods of time and added to each of them the documentation name and conventional symbols. In the result of all implemented researching work we had designed using above mentioned methods to five graphical documents which characterized changes of cemetery boundaries depending on the time, showing the land they occupied and the area where the mass killings of the civil people and prisoners of war when Kiyiv was occupied by Nazi. The zone of the mass killings was marked based on the complex of the researching by the narrative, photo and cartographic materials and methods and the 3-sized reconstruction of the Babyn Yar terrain. Additionally it was shown the whole territory of Babyn Yar, where it was located. All graphic documentation is accompanied by this text. Prepared by Mr. Boris Chetverikov |
    
BESTHOSTING хостинг на серверах в Україні, США та Німеччині. Домен БЕЗКОШТОВНО! |
 |
© Громадський комітет «Бабин Яр», 2007-2024 |
Generated by Alex:DB:Manager |